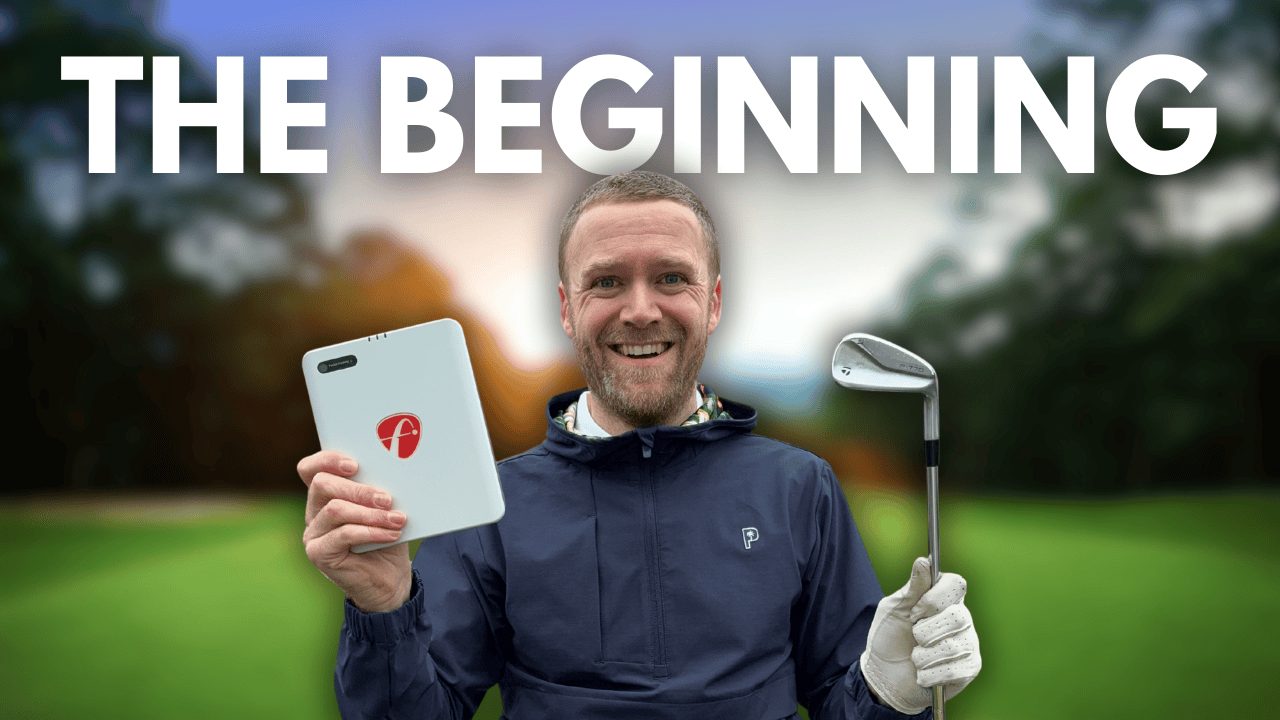
With the start of the main golf season not too far away, I’ve recently been looking at how I can get my swing in shape and what better way to do so than using my deWiz golf swing analyser. This device is incredible. Not only can it be used without hitting golf balls or whilst hitting balls at the driving range, it can also be used when playing a round, thanks to its new ‘On-course’ mode.
In this week’s Weekly Wedge video, I explain how this mode works and take a deep dive into the data the device automatically tracked during a recent 9-hole round. As well as looking at my swing data, I’ll also compare my data with tour professionals thanks to the deWiz data dashboard.
I hope you enjoy this week’s episode and taking a closer look at the deWiz product. If you do, then be sure to check out my other recent video where I looked at using the deWiz to improve my swing tempo.
View video transcript
Introduction and DeWiz On-Course Mode
Hello, welcome back to the channel. Now this is episode two of my brand new Weekly Wedge series. If you missed episode one which dropped last week, I was looking at a club gapping issue in my bag and hoping that you guys could help me to address that issue. In this particular video for episode two, I am going to tell you about this—this is the deWiz. Now this is a golf swing analyser, it’s probably one of the best on the market at analysing your golf swing, and I’ve been using it for a while now when practicing in the garden or using it at the driving range. This week I tried out a brand new feature on the device which is the On-Course mode, so I’ll tell you a bit more about that in just a minute. Now if you are interested in seeing how I’ve used the deWiz before to try and improve my swing tempo, then there’s a link in the description below to a previous video I worked on where I was basically practicing my swing in the garden and showing you how I could take my swing data and analyse it and compare it with that of some Tour Professionals to hopefully try and improve my tempo.
Testing the On-Course Mode
Now this week I took the deWiz out to my local golf club and in particular the small nine-hole course to just test out how well the On-Course mode works. Now basically what happens is you put the deWiz on your wrist (so that’s the watch there), you basically pair it with your phone, you open the app, you initiate a round, and you play golf. What’s particularly good about this is it captures all of the data about each swing whilst you play, and then after you finish playing, you can basically take a look at all of the metrics for each swing, each shot that you played, and start to analyse it. And I thought in this video I would just show you some of the data that I have collected. Now the important thing with this is you can’t actually view or edit the data as you play because it’s designed to be used in competitive matches. So if you’re playing competitive golf and you want to track all of your shots and all of that information, then you can do so without worrying about being penalised. The important thing to mention though is it’s not tracking your performance data in the same way that Shot Scope do, so it’s not telling you how far you hit each shot, what club you used, if you missed the greens, made the greens, hit fairways, that kind of thing. That’s very much what my Shot Scope X5 does, but this is actually analysing all of the data about each individual golf swing.
Reviewing the Data in the DeWiz App
So what I’m going to do now is I’m going to show you what the deWiz app looks like once you have finished your round and what kind of data we can access that we have collected. I’ll also overlay on screen my swings that are recorded during the round, so if I’m talking about one particular swing, I’ll just put that swing on a loop so you can see the actual swing, the actual shot, and we can talk about the data that we have captured. So first of all, when we go into the app, we can look at all of our data for all of the swings and sessions that we’ve had, but I want to focus this one here on February the 19th; that’s the session that I captured 15 swings on. Now it is worth mentioning that I was playing the small par 3 nine-hole course, which means that I’m not using things like drivers, four irons, five irons—basically everything between a seven iron and a putter was used, and I tried to purposely mix up my clubs so that I could collect quite a bit of data. My thinking with this is I want to use this on a much more regular basis when I’m playing to collect a lot more. The sample’s quite small, but hopefully it’ll give you an idea of just how we can actually utilise this data that the deWiz is giving us access to.
Initial Session Data Overview
So first of all, you’ll see on this screen here this is a bit of information about my session. So 80% of the shots were straight. I actually shot one under par for that, so the round was a really positive round. But we can see if we’ve put any balls slightly left or really far left. Now we’re not talking about sort of miss-hits or anything like that, this is recording the actual the decent swings. So where it’s got a green arrow forward, that’s generally just a really good straight shot. So we can see here under analysis, with my 8-iron, my average transition was 2 cm. Now I’ll dig a little bit deeper in a second about transition, but your transition is basically the movement whether you’re over the top or under plane, and you’re looking for around about 0 cm there. Okay, there’s a bit of tolerance, but you’re generally looking for 0 cm, or in my case, I’d probably prefer a negative number because positive means you’re over the top, negative means you’re under. Then you can see we can see our data here for the transition on a 7-iron and on my 9-iron. So there’s a slight difference between the seven and eight when compared with the nine—a little bit steeper or a bit over the top, should I say, with the 9-iron.
Deep Dive into an 8-Iron Swing
But anyway, what I’m going to do is I’m going to tap on show swings, and then this shows you all of the shots that I played. So there’s a couple of 60s in there, there’s a couple of 56, and what I want to do with this is I want to highlight a couple of the shots I know I hit really, really well in terms of the distance, the ball flight, and whatnot. So let’s jump to hole number six where I hit an 8-iron. Now I can tap on the little picture of the golfer here and this will actually show you the swing. Now of course the little model there that’s swinging will be generic, but you can see some information about what the deWiz has tracked in my swing. So this is a down-the-line view. If I press play, you can see the blue line is the back swing and the green line is the down swing. So in this case, it is a little bit over the top, and that’s where the transition comes in of 3 cm. So whilst it was a good strike, the transition there was a little bit higher than I would have liked. So looking at this information, if I was to go and record lots and lots of shots with the 8-iron and I was consistently a 3 to 4 cm transition here, I might want to look at that as an opportunity to try and get more under plane or at least on plane with my swing. You can also change to the face-on view like this for example, and you can change to a target view as well, which is pretty neat.
Understanding the Transition Metric
Let’s go back to down the line though. Now if I was looking at this data and I didn’t really know much about it, because there are lots of numbers here, you can tap on the information next to each one. So this is transition and it will tell me basically what transition is and then it will tell me how I can improve it. So transition measures the difference between your back swing and down swing. The measurement is taken approximately 20 cm into your downswing. So it says here, for example, if you hit a slice, your transition numbers are likely to be positive, which is the case for me, indicating an over-the-top transition. To minimise your slice, try to get the transition numbers closer to zero, which is classed as neutral, or slightly negative. But at the bottom it does say generally being within 3 cm of a neutral (either positive or negative) is a good range to hit the ball straighter and more consistently.
Other Key Metrics (Tempo and Hand Direction)
If we go down, let’s have a look at Tempo, so that’s one of the things I was trying to address in my previous video—again, link in the description below. But my tempo for this particular swing was 2.4 to 1. It tells me the length of my back swing in terms of time and my down swing, but it also tells me how quickly I managed to get to impact and whether there was a pause of my swing. Again, I can tap on the information here and it breaks down everything that is measured here and gives me more information about these data points. Things like length of backswing for example, if I press on the information here, it’s going to tell me a bit about what we’re sort of aiming for with length of back swing and whether that’s something that I want to focus on. So you can get the impression from here that there is a heck of a lot of data, but what happens is when we tap on any of the information areas, we get more information about what these things are, and then once we build up the data, we can start looking at how we can improve these specific points. So for example, this initial downswing direction X is the basically the angle at which your hands come down from your initial movement. So if you have a positive number, it means that your hands start to downswing towards your toes, and a value of zero means that your hands drop straight down. So what you’re kind of looking for is looking for something that sits around about between 5 and 15 degrees. So you see an ideal IDX range of 5 to 15. So I can jump back and have a look at mine and mine is 12, so actually it’s not too bad. But I’m not going to sit and go through all of these things, but you can see there is a lot of data collected here. And of course I can jump back in and let’s go and look at some other swings. I’ve captured all of my swings here, so even like a little 56 on the fifth hole, which was just short of the green, I can get a bit more information about that. So you see for example this one was a little bit of a shorter swing there, so we don’t get the full length of back swing and whatnot because it’s just a very, very short swing, but even this kind of information at 43 cm length of back swing is useful to have. The important thing of course is being able to accurately interrogate it and then work out what I’m going to do with this data to improve.
Comparing Data with Tour Professionals
But one thing that is very useful is we’ve been looking at captured data and then we can look at the information for each data point to try and work out what it should be, and then we can go in practice swings and improve it. But you can also compare your data with the touring professionals. Now the deWiz is a device that is really, really popular right now within the professional game as well. There are several players who have endorsed the product: Annika Sörenstam and Vijay Singh, Henrik Stenson, and Adrian Meronk has also recently just partnered with deWiz. So a lot of their swings have been analysed and we actually have access to that information on the data dashboard where we can start comparing our swings to that of the Tour Professionals. So now what I want to do before we finish this video is I want to show you how some of those swings compare with the pros so I can work out if my length of back swing meets those of Henrik Stenson for specific clubs for example, or if maybe I’m a little bit too short I might want to increase them. So I’m going to jump on the laptop and I’m going to show you some of the comparisons with the Tour Professionals just now.
Data Dashboard Comparisons (Example: Henrik Stenson 8-Iron)
Okay, so this is what the insights look like within the deWiz data dashboard. Along the top you can compare against these various players and you can set a date range, and then you can also choose on the left-hand side the specific clubs or you can choose the session type. So I’m going to go for On Course. I’ve actually already filtered here so it’s only going to show that one session, but then what I might want to do is let’s load up that 8-iron again and then let’s have a look at how I compare with any of the players who we have data for with an 8-iron. So let’s go for Henrik Stenson in this example. And then you’ll see as I scroll down I can see Henrik Stenson’s transition. So my transition on average with that club during that particular date range on course was 2.2 cm. Again, we’re trying to get the transition as close to zero as possible. Henrik Stenson’s is 1.5. So we can compare the two. We can see that Stenson’s is around about 7 cm better or closer to zero than mine. We can see that with the 8-iron his length of back swing is around about—it was about 20, close to 20 cm longer in terms of his back swing length than my 8-iron. We can have a look at his tempo for example, so he’s got a slightly better tempo than me; 3 to 1 is the ideal tempo, and that most players will be looking for. That’s certainly what I’ve been using the device to try and get closer to. You’ll see here 2.4 versus 2.76. And then we can look down at things like the back swing duration. So actually that’s one thing we are bang on with. And then the down swing duration—mine is slightly slower than Henrik Stenson. And then we can look at things like the hand speed, so you see his hands are much, much quicker through the swing, through the down swing, than mine.
Data Dashboard Comparisons (Example: Nine Iron and Other Pros)
We can then have a look at 9-iron for example, so we can see how they compare. So with his 9-iron, his hands are again quite quicker than mine, and they’re quicker than they are with his 8-iron. You can see that his length of back swing is slightly shorter with his 9-iron, but look at the difference with his transition: he’s minus three with his 9-iron compared to 1.5, but compared with my 3 cm. So we’ve almost got 6 cm worth of difference there in the transition. We can jump in and look at other players too. So if we look at Vijay Singh for example, again, and let’s load his one up, so he has actually got with his 9-iron a very, a much higher transition, much more positive. So with the measurements here, he’s probably going to be a little bit more out-to-in than some of the other pros. He’s got much, much, much longer back swing here with his 9-iron. Let’s jump in look at the 8-iron and see if we can compare them. So you can see again positive numbers from Vijay Singh here, again longer back swing. Tempo is closer to mine, so there could be the element of age as well with the players which makes a difference. So obviously it’s difficult if you are comparing with them which players you’re going to compare with. And we can see here if I go to Annika, you can see with her 8-iron transition minus 0.9, so actually negative, again a lot, lot closer to zero than mine. Length of back swing, interestingly the 8-iron considerably shorter than mine. So there is a lot of information that can be pulled from this dashboard and I want to track a lot more of my swings before I really start digging down and comparing, but it is useful to see this information.
Conclusion and Next Steps
So there you have it, that’s how I have been using the deWiz this week. I’m going to keep using it and capturing more data, probably from full rounds out on the golf course, and then my plan with this is to get in touch with deWiz and ask if they can interrogate my data to give me some advice as to exactly what they think I should be working on, and I’ll be sure to record that webinar so that I can share it with you guys via another video and you can get more of an idea as to what the deWiz themselves would recommend I do to fix my golf swing based on the data collected. Now in other news this week I have taken delivery of this—this is the Shot Scope Pro ZR Laser Rangefinder, brand new offering from Shot Scope. I’ve just released a video which shows you what comes inside the box and we take a first look at this wonderful new product. So if you’re interested in that then I’ll put a link at the end of this video. Remember there is also the video where I talk about the deWiz and in particular the tempo training, so you can have a watch of that video if you’re interested. And remember if you do want to buy a deWiz or just find out more, then hit the link in the description below where you’ll also find a handy 10% discount code. Anyway, thank you very much for watching and I’ll see you in next week’s video.
If you enjoyed this video then be sure to head over to my YouTube channel and subscribe so that you’re notified when next week’s video drops.